Have many module support for Excel as create, write data, table and paint graph function. But these module don’t support for some graph as Bubble, Scatter..
This post, I will guide for you create Bubble graph by Macro code.
Macro use Visual Basic (VB) language,

Step 1: create label with data for Bubble Graph

Step 2: Paint the Bubble Graph by Macro code
In Objects/ThisWorkbook:
//Microsoft Excel Objects/ThisWorkbook
Private Sub Workbook_Open()
    Call Module1.bubble
End Sub
in Modules, create Module1 with the content:
//Modules/Module1
Sub bubble()
    On Error Resume Next
    sheetName = "Sheet1"
    nameBubble = "EF"
    xVAlueBubble = "EG"
    valueBubble = "EH"
    sizeBubble = "EI"

    Worksheets(sheetName).Select
    Dim chartObj As ChartObject
    Dim ns As Series
    Dim objRange As Range
    Dim cntData As Integer
    Dim arrColor As Variant

    cntData = Range(sizeBubble & "1").EntireColumn.SpecialCells(xlCellTypeConstants).Count
    If cntData > 1 Then
        Set chartObj = ActiveSheet.ChartObjects.Add(0, 100, 800, 500)
        chartObj.Chart.ChartType = xlBubble
        'SeriesCollection collection
        For i = 1 To cntData - 1
            'set Series Collection
            Set ns = chartObj.Chart.SeriesCollection.NewSeries
            ns.Name = "=" & sheetName & "!$" & nameBubble & "$" & (i + 1)
            ns.XValues = "=" & sheetName & "!$" & xVAlueBubble & "$" & (i + 1)
            ns.Values = "=" & sheetName & "!$" & valueBubble & "$" & (i + 1)
            ns.BubbleSizes = "=" & sheetName & "!$" & sizeBubble & "$" & (i + 1)
            ns.HasDataLabels = True
            ns.DataLabels.ShowSeriesName = True
            ns.DataLabels.ShowCategoryName = False
            ns.DataLabels.ShowValue = False
        Next i
        'set coordinates axis
        chartObj.Chart.DisplayBlanksAs = xlZero
        chartObj.Chart.Axes(xlCategory).Select
        chartObj.Chart.Axes(xlCategory).CrossesAt = 1
        chartObj.Chart.Axes(xlValue).Select
        chartObj.Chart.Axes(xlValue).CrossesAt = 1
        chartObj.Chart.Axes(xlValue).HasMajorGridlines = False
        chartObj.Chart.Axes(xlValue).HasMinorGridlines = False
        'set position of graph
        chartObj.Top = Range("EF18").Top
        chartObj.Left = Range("EF18").Left
        chartObj.Chart.ChartArea.Border.LineStyle = xlNone
        chartObj.Chart.PlotArea.Border.LineStyle = xlNone

    End If
End Sub
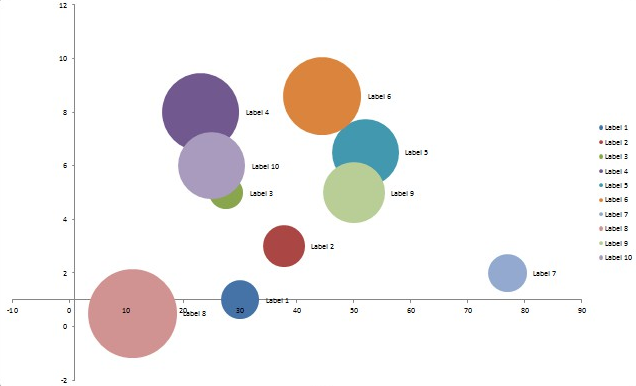
Step 3: Save file and run script or reopen that file and see result

Hope userful for you.